f <- function(x) {
  y <- -8 - 2 * x + x^2
  return(y)
}16 Making Functions
16.1 Creating Simple Functions
It is very easy to make your own customized functions in R. Suppose, for example, you want to make an R function to calculate the output of the quadratic function:
f(x) = -8 -2x +x^2
If we want to call this function f(), we would define it as follows:
The f is what we want to call the function. We assign to f using the assignment operator, <-, the “function” with a single argument x using function(x). After that we specify what the function is supposed to do:
- Calculate
y <- -8 - 2 * x + x^2 - Return
yas the output. We use thereturn()function to specify what the output of the function is.
We need to wrap what the function does in curly brackets ({ }) because what the function does can span several lines. Using the curly brackets tells R that these commands below together in the function.
Let’s try out the function:
f(2)[1] -8f(3)[1] -5We can also pass a vector into the function to see the output for several values at once:
f(c(2, 3, 4))[1] -8 -5 016.2 Plotting Functions
We can also use ggplot() to plot the function. To do this we first create a sequence of values of x where we want to evaluate the function. We then evaluate the function for each of these values of x and save it as y. We then combine x and y into a data.frame and plot it like we learned in Chapter 14.
Let’s give it a try:
library(ggplot2)
x <- seq(from = -4, to = 6, length.out = 200)
y <- f(x)
df <- data.frame(x, y)
ggplot(df, aes(x, y)) + geom_line()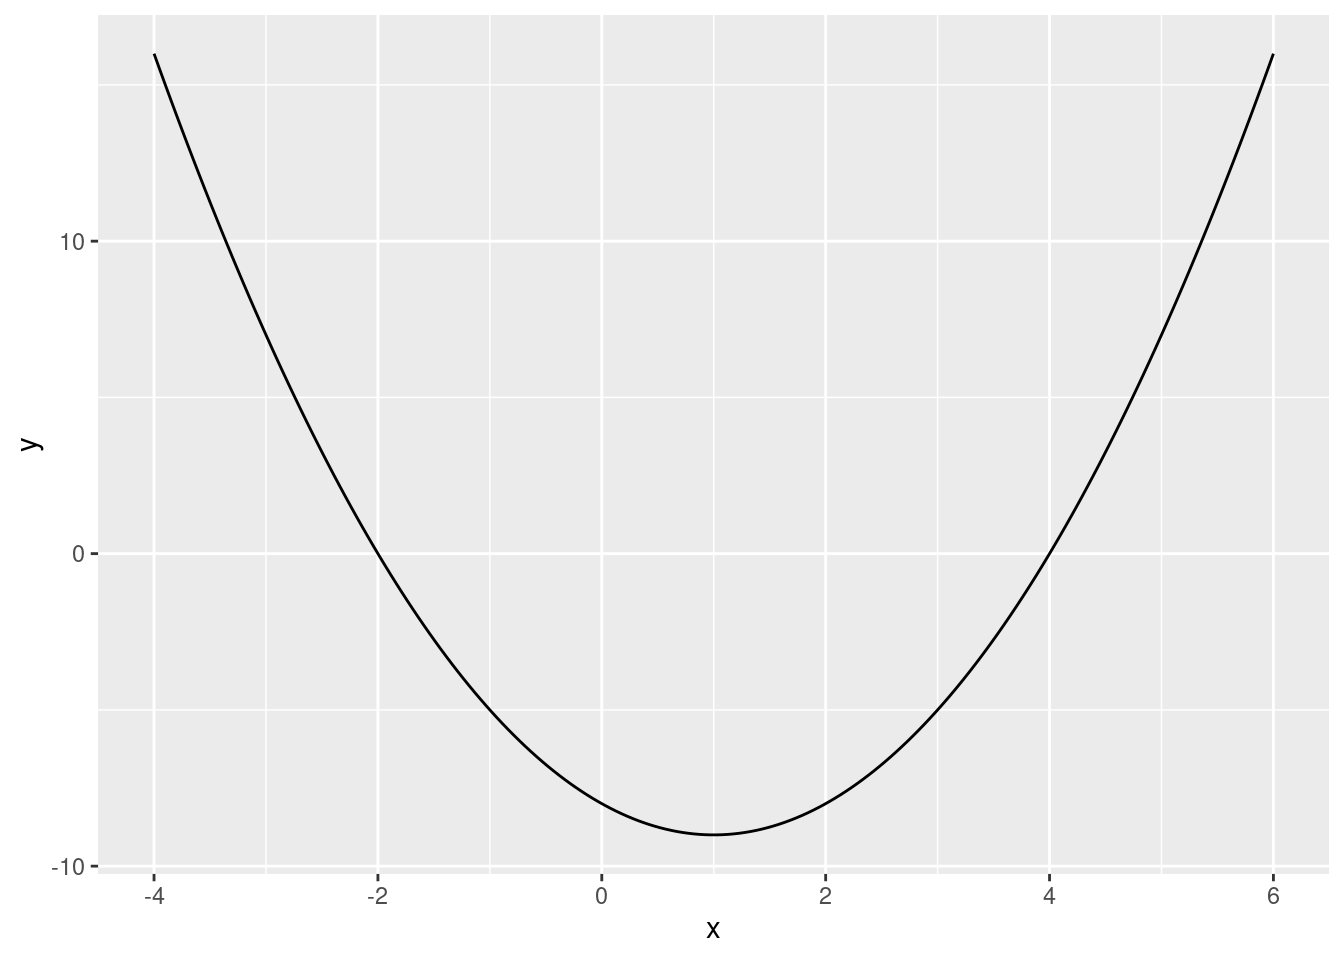
In this example, the sequence runs from -4 to +6. The length.out option specifies how many numbers in total there should be in the sequence between -4 and +6. 200 numbers is plenty to get a curve that looks smooth. Why did we use -4 and +6 here? This range includes minimum and gives a good idea of its shape. You can try out different ranges instead (using numbers different from -4 and +6. When making these plots the easiest thing to do is try out different numbers until the plot looks good.